Every number that matters. And the intelligence to read it.
Revenue and Growth, on one screen, per product. See the money that came in, where it came from, and what moved it — from raw transactions to AI that tells you what to do next.
01 Revenue
The money side of your dashboard — from today's transactions to the recovery trend after an outage.
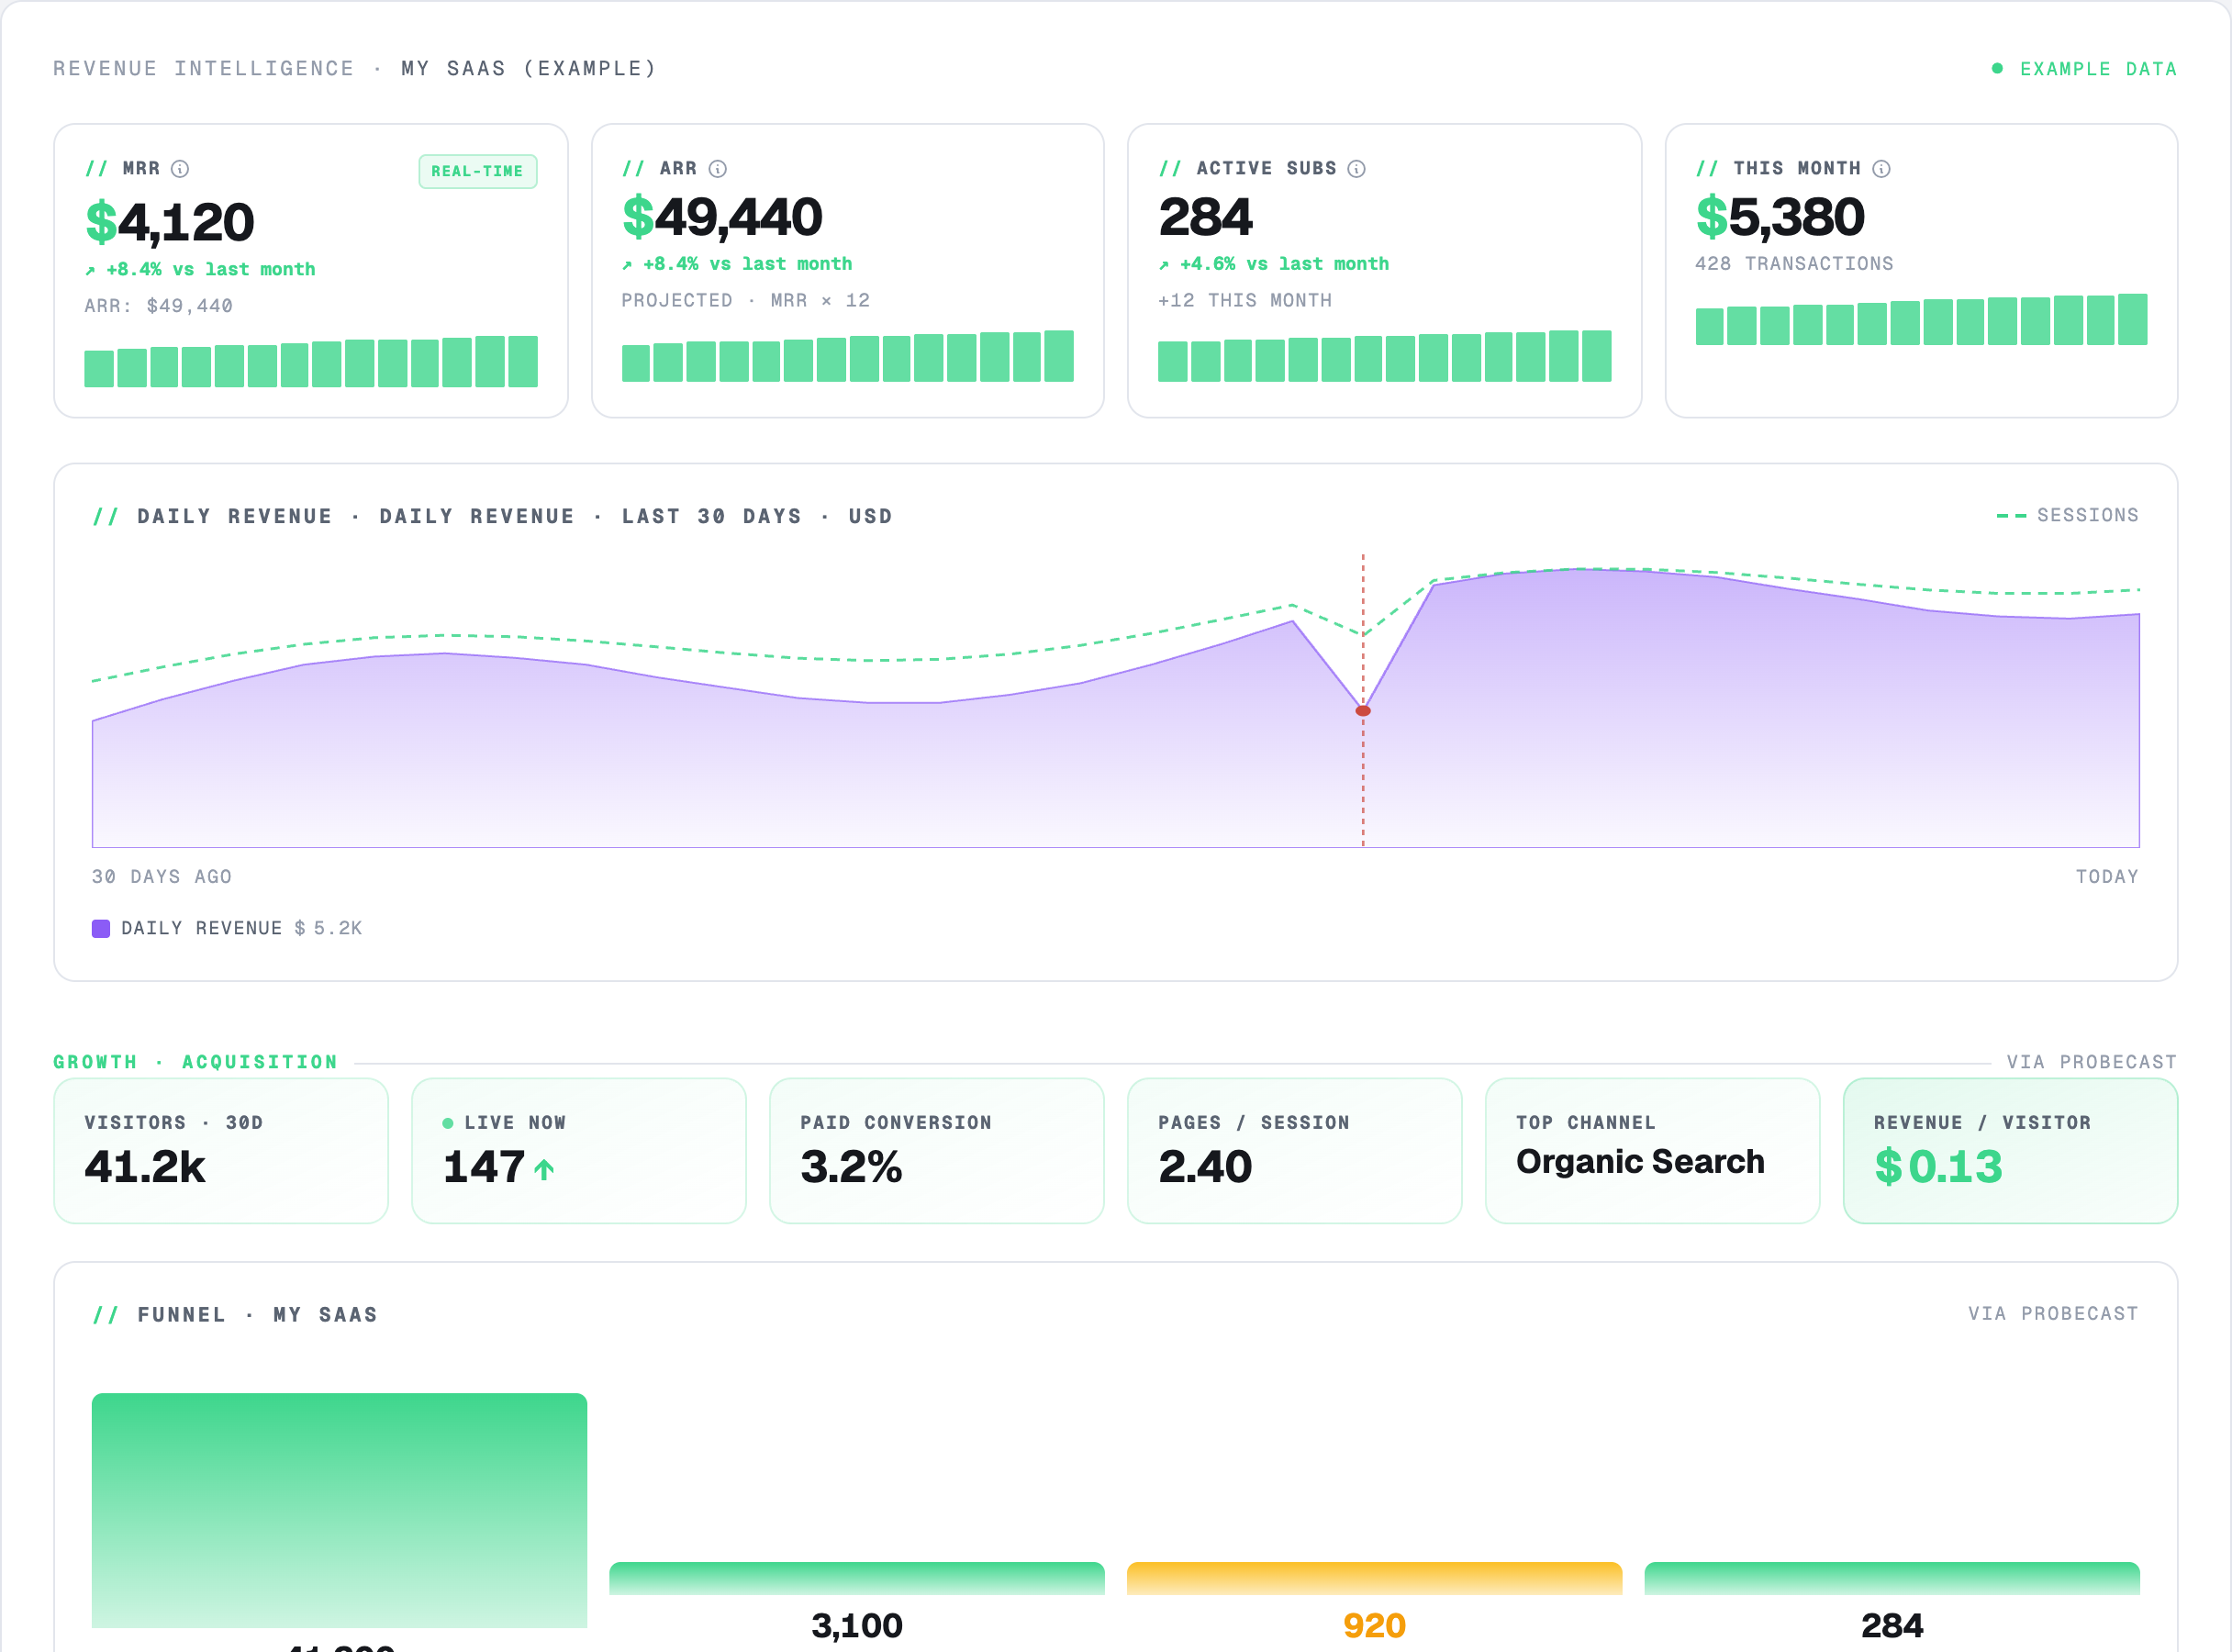
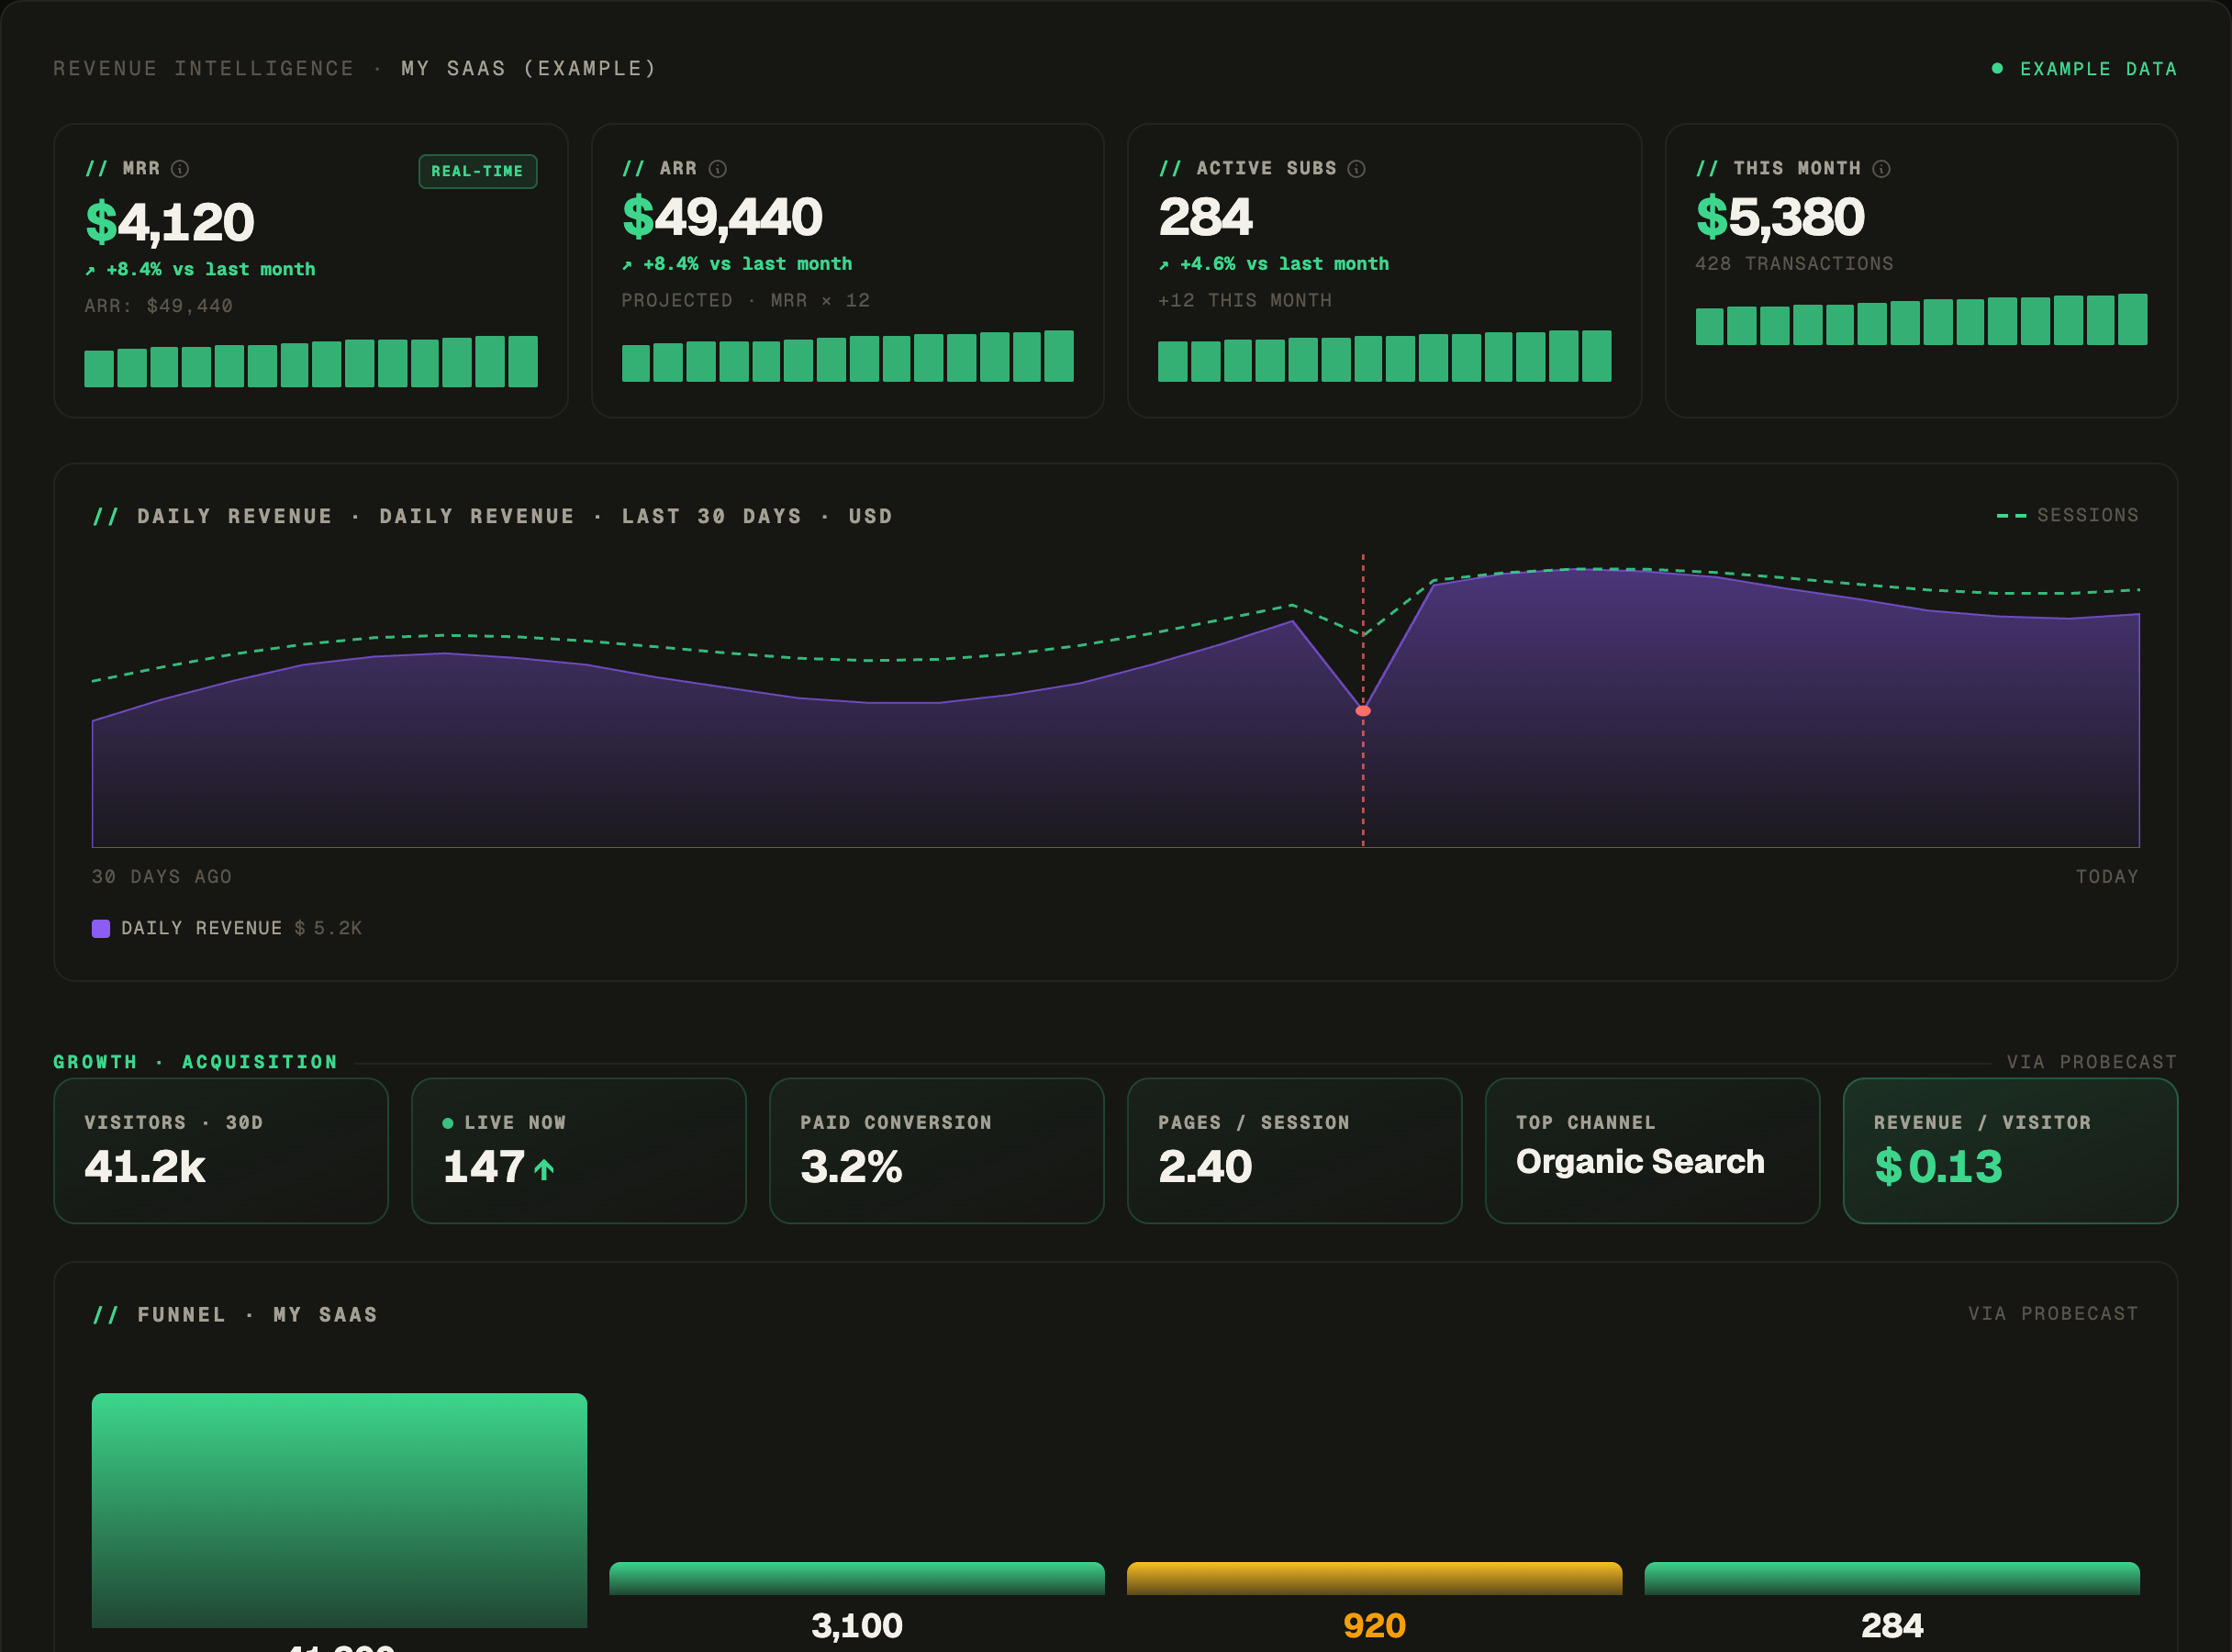
Today / month / 30-day transactions — successful and failed — plus daily revenue.
MRR, ARR, active subscriptions, breakdown by plan, churn, net MRR change, trial conversion.
Total customers and ARPU, at a glance.
30-day sparklines for MRR, ARR, active subs and ARPU, with period-over-period change.
Daily revenue stacked by product, with incident markers laid over it.
Revenue split by currency for multi-currency accounts (e.g. R$4,120 · €900 · $2,300).
Connect Stripe, PayPal, Paddle, Lemon Squeezy — read-only keys.
App Store Connect and Google Play sales, in the same view.
What an incident actually cost: revenue at risk = failed payments in the outage window.
Revenue by hour against incidents — find your peak hours and where they got hit.
Traffic crossed with revenue on a 7×24 hour-of-week grid — see whether your busiest hours are also your best-paying ones. Toggle between traffic and revenue; works with GA or the first-party pixel.
How fast and how fully you bounce back after incidents — a recovery trend.
A timeline of what moved the money: revenue added, incidents, campaigns, recoveries.
An LLM reads your revenue and growth signals and writes named recommendations — e.g. “cut the Reddit-AMA spend, fix mobile checkout.”
A revenue × incident correlation summary, delivered to your inbox.
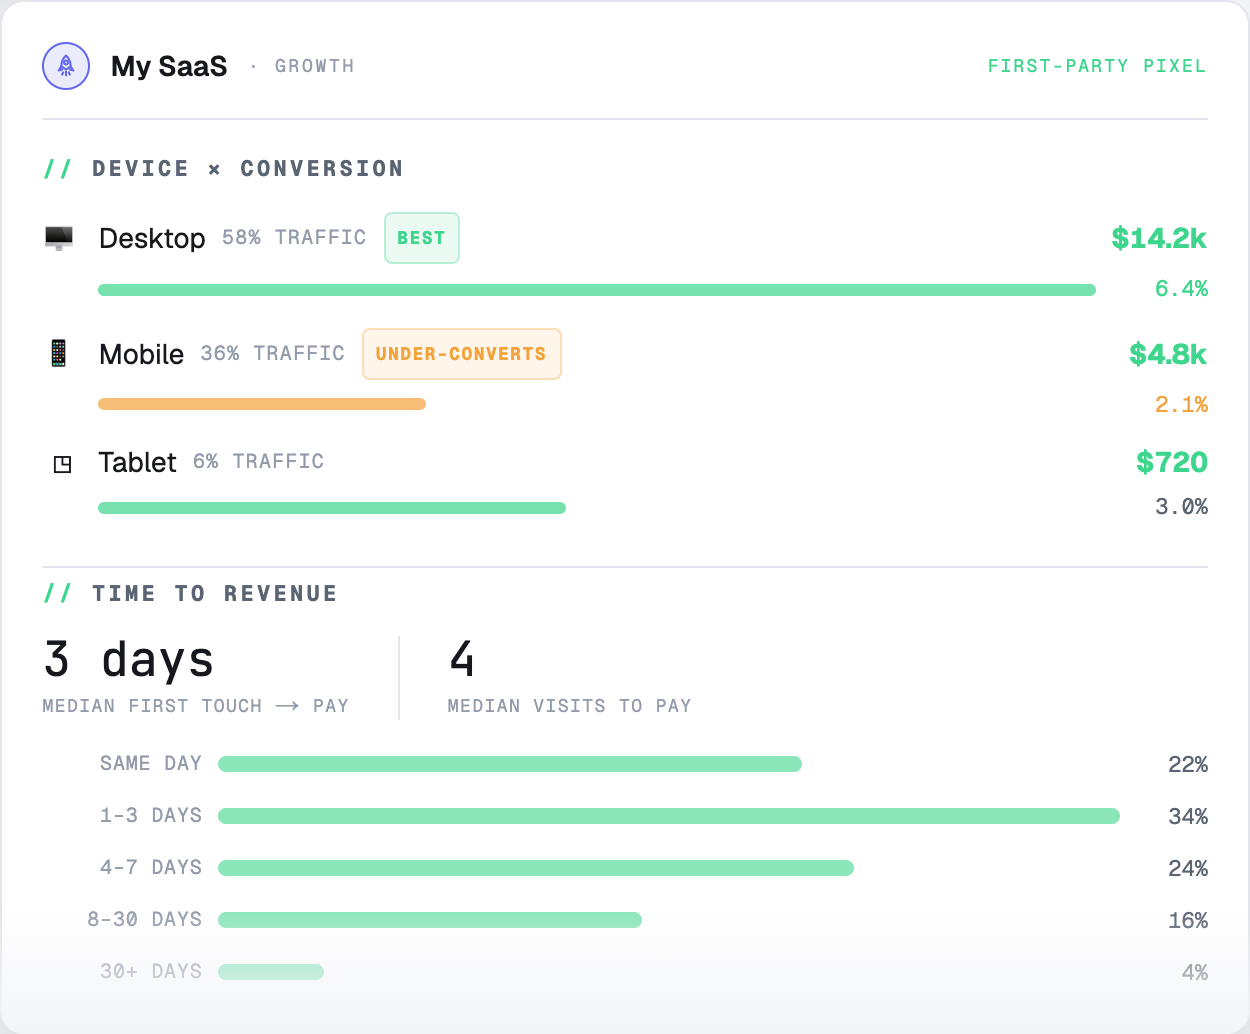
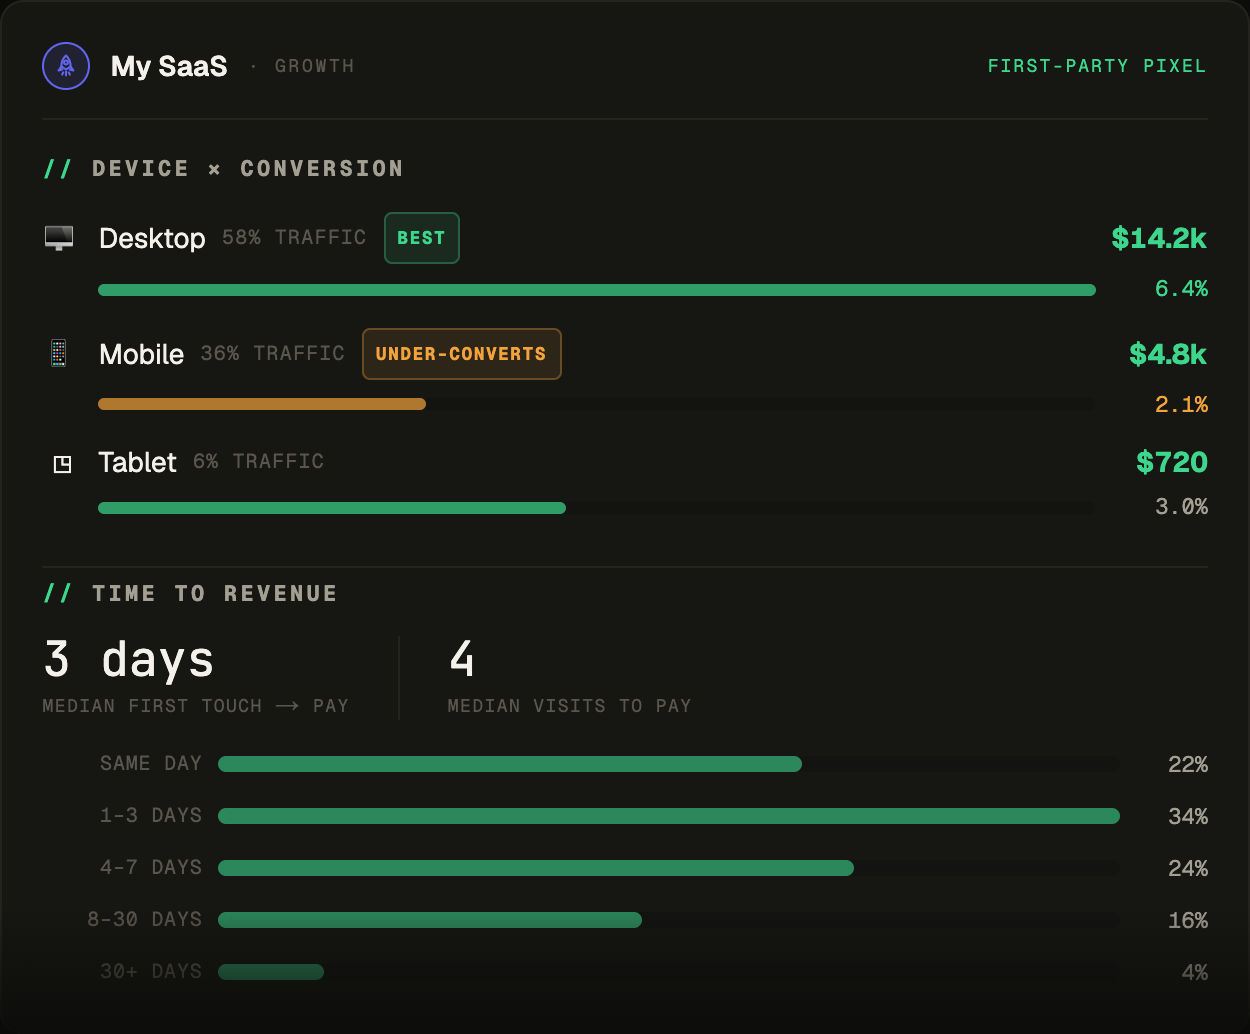
02 Growth (acquisition)
Where your revenue comes from — channels, funnel, geography, journeys. Per product.
Feed Growth from the Google Analytics you already have, or from Probecast's own tracking — first-party, cookieless by default, no sampling, no PII. Some journey-level views are only possible with our own tracking, because GA doesn't provide that data in our model.
Visitors (30d), live now, conversion rate, average engagement, top channel, revenue per visitor.
Visitors → sign-ups → trials → paid, with the biggest leak flagged automatically.
Traffic share vs revenue share per channel, attributed to real Stripe dollars.
Where it pays — traffic vs revenue share per country, flagging who over-indexes.
Per URL: views, visitors, conversion and revenue (last-touch); marks best and leaking.
First-touch attribution from your utm_* — revenue and revenue per visitor, per campaign.
Desktop / mobile / tablet: traffic, conversion and revenue — find the “mobile under-converts.”
The buying journey: median days and visits to first payment, plus the distribution.
Traffic drops correlated with incident windows.